
Causes of grid congestion in the Netherlands: a guide for businesses
Direct answer
Grid congestion is overload of the electricity network: at specific locations and times, the demand for or supply of power exceeds what the grid can transport. The main causes of grid congestion in the Netherlands are rapidly rising electricity demand driven by electrification, strong growth of solar and wind power feeding into the grid, and grid expansion that cannot keep pace.
- Clear definition
- Data-driven assessment
- Risks and opportunities visible
- Practical next steps
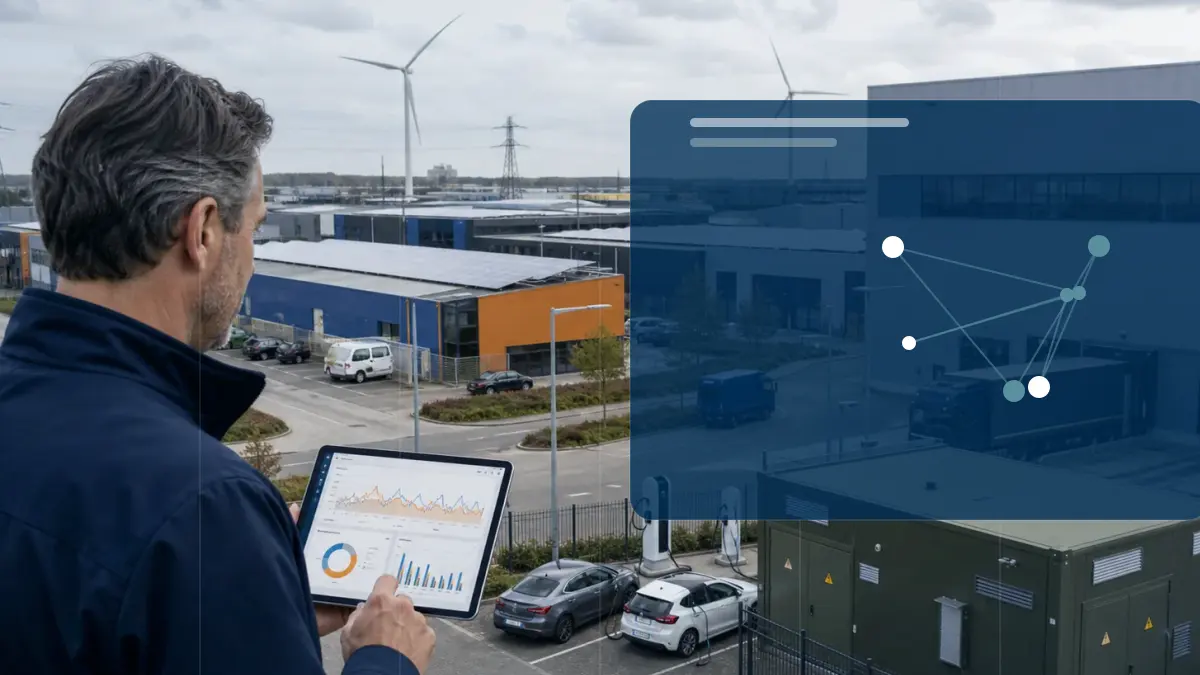
Causes of grid congestion in the Netherlands: scattered information versus Energy Intelligence
The Netherlands is electrifying at a rapid pace. Factories are switching from gas to electricity, vehicle fleets are going electric and solar panels cover more and more rooftops. The electricity grid has not grown at the same rate. A business applying for a heavier connection therefore increasingly hears from its grid operator that no transport capacity is available. Understanding the causes explains why the situation differs per region and per moment, and which options remain.
- Electricity demand is rising fast because households and businesses are electrifying: heat pumps, charging points, induction cooking and electric industrial processes.
- Solar panels and wind turbines feed in large volumes of power at peak moments, often at different locations and times than consumption.
- Grid expansion takes years due to permits and construction time, creating waiting lists for new or heavier connections in congested areas.
Insight
Traditional approach
Information is scattered across portals, documents, invoices or separate spreadsheets.
Modern approach
Data, context and interpretation are brought together into a clear decision picture.
Decision-making
Traditional approach
Choices are made based on averages, assumptions or occasional analyses.
Modern approach
Scenarios, KPIs and current measurement data make the trade-off more concrete and repeatable.
Follow-up
Traditional approach
Actions often stay non-committal or disappear into separate reports.
Modern approach
Follow-up actions, monitoring and reporting are linked to the same energy data.
What is overloading the power grid?
The grid becomes overloaded because electricity demand and supply are both growing rapidly and often coincide in time. Households use heat pumps and induction hobs and charge their electric cars at the end of the day. Businesses are replacing fossil fuel processes with electric ones. Demand therefore peaks mainly between 4 pm and 9 pm. At the same time, solar panels and wind turbines feed in large volumes of power on sunny and windy days. Generation and consumption rarely happen at the same location and at the same moment. The grid has to bridge those differences and is reaching its maximum capacity in more and more places.
- Electrification of heating, transport and business processes is driving up electricity demand.
- Demand peaks mainly between 4 pm and 9 pm.
- Solar and wind feed in large volumes of power at peak moments.
- Generation and consumption rarely coincide in place and time.
Why is the grid not growing fast enough?
Demand for transport capacity has risen much faster than the pace at which grid operators can expand the network. Grid operators invest billions of euros each year in reinforcement and new substations. Even so, an expansion takes years to complete: it requires permits, land and construction capacity. The Dutch government is trying to speed up these procedures, for instance by designating grid expansion as a matter of compelling public interest. Until an expansion is ready, congested grid areas have a waiting list for new or heavier large-consumer connections. Congestion is also bound to time, place and direction: a grid section can be full for offtake, for feed-in or for both, while capacity remains available elsewhere.
- Grid operators invest billions of euros in the electricity grid every year.
- Permits, land acquisition and construction time make expansion a matter of years.
- Congested grid areas have waiting lists for new or heavier connections.
- Congestion differs per location, per moment and per direction (offtake or feed-in).
What can your business do about grid congestion?
You do not always have to wait for grid reinforcement. RVO and the grid operators describe several routes to do more within your existing connection. With energy management you shift flexible processes to hours when the grid has capacity. A battery absorbs peaks and stores your own solar power for later use. With a flexible contract you reduce your consumption at peak moments and receive compensation or a discount from the grid operator in return. Businesses on the same site can use an energy hub to agree on shared contracted capacity and coordinate demand and supply. Also ask your grid operator whether congestion management creates room in your region.
- Energy management: shift flexible consumption to moments when the grid has capacity.
- Battery storage absorbs peaks and makes better use of your own generation.
- A flexible contract with the grid operator compensates you for reducing consumption at peak moments.
- Energy hubs let businesses share and coordinate grid capacity together.
- Cable pooling combines multiple energy sources on a single grid connection.
Curious what this looks like with your own data?
In a no-obligation call, a specialist looks at your meters, sites and energy questions with you. Response within one business day.
Search the knowledge base
Find the answer to your question.
Search using your own words. Abbreviations and spelling variants are recognised, so EMS also finds the articles on energy management systems.
Topic
