
For production, warehouses, cold stores and charging hubs
Industry & logistics
Analyse peak load, production profiles, charging infrastructure, contracted capacity and capacity risks.
Pricing model
Modular per meter, confirmed after scope
Start with Consumption Analysis per meter. You only add Financial Analysis and Capacity Analysis when they add value.

01
The approach
From recognizable situations to concrete data questions.
02
Sector profile
Quarter-hour values reveal peaks and baseload consumption.
03
Where the money is
Cost, capacity and anomalies come together in an action view.

The approach
The energy profile as a production asset.
In industry the highest quarter-hour sets the bill and, in a congested grid area, how much room is left to grow. COMCAM traces every peak back to line, machine group and moment, so the profile becomes a lever you operate yourself.

Recognise
The residual load outside production hours becomes attributable per hall and per meter: compressed air, standby equipment and lighting that keep running.
Explain
Peaks are traced to machine and moment. You see which quarter-hour maxes out the contract and which processes stack on it.
Steer
Start-up sequences and batch planning push down the defining peak. A battery or contract adjustment only follows once the profile substantiates it.
Where industry & logistics often runs into trouble.
Energy Intelligence is positioned differently for each sector. The value lies in recognisable situations, not in generic dashboards.
Peak loads
Contracted capacity
Charging infrastructure
Process-dependent consumption
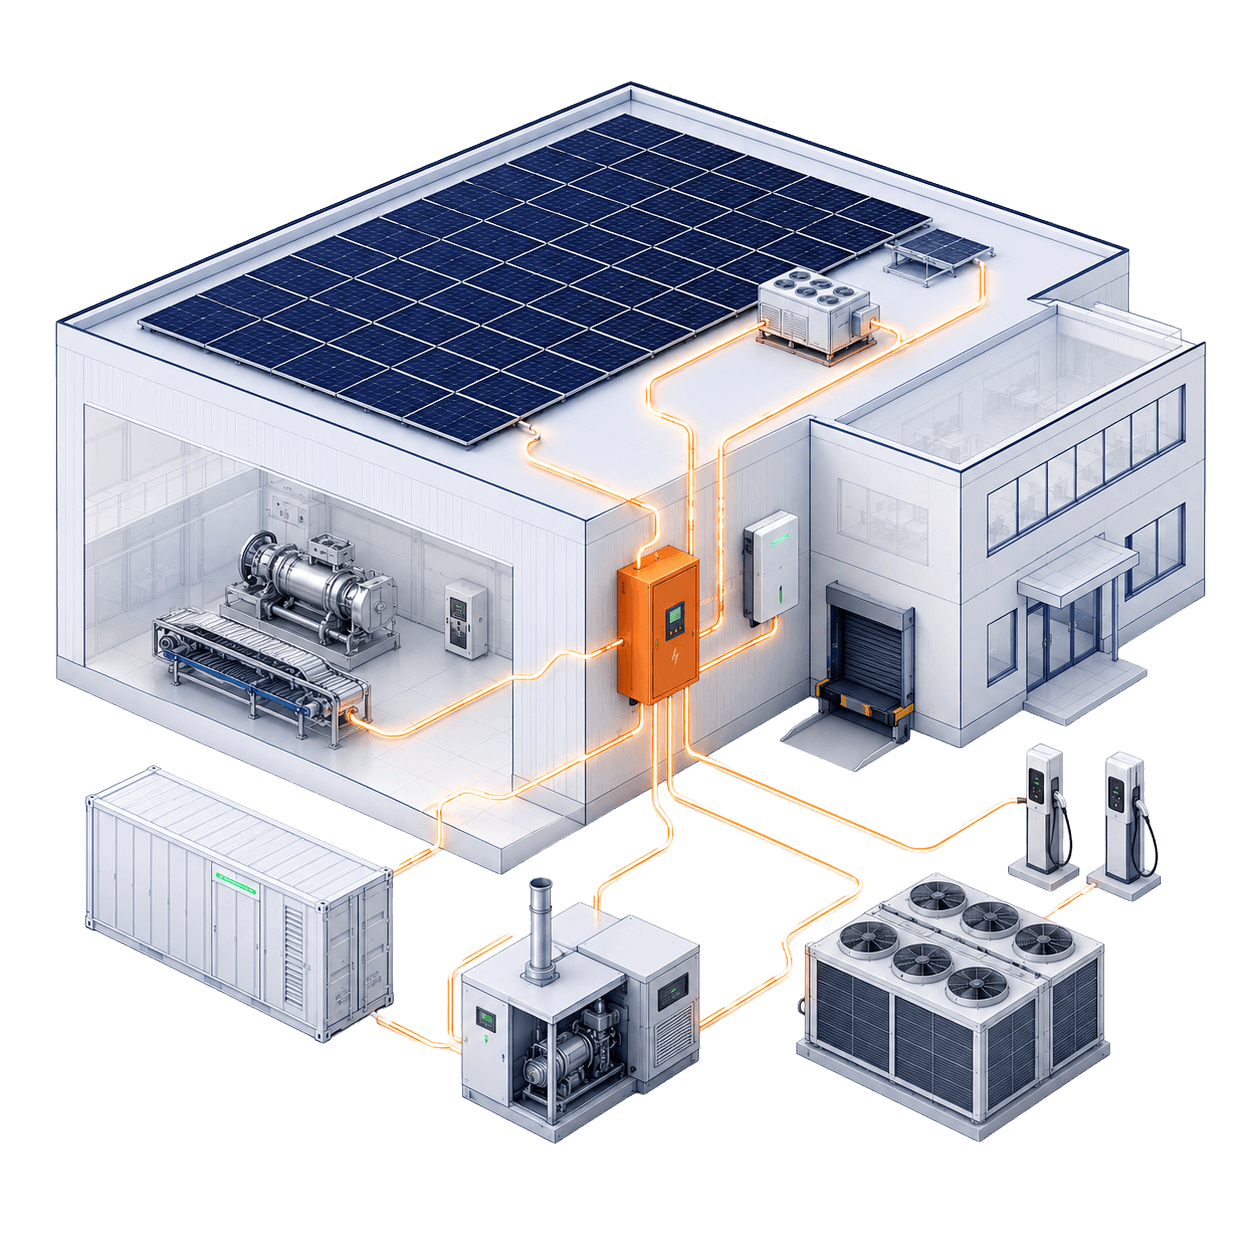
The energy model
Industry & logistics
Where consumption, generation and steering come together in this sector: from meters and cooling to solar panels and charging infrastructure.
Sector profile
The industry profile: process peaks set the bill, and your room on the grid.
Day profile in quarter-hour valuesNight-time residual load
Whatever keeps running outside production: compressed-air leaks, standby equipment, hall lighting.
Production start
Lines starting simultaneously set the defining peak. Sequential start-up can push it down.
Process peaks
Batch processes and compressors stack on top of the plateau, traceable to machine and moment.
Contracted capacity
Under congestion this is your ceiling. Every kW of headroom the profile finds is room to grow.
Where the money is
Three insights that make the difference in industry & logistics.
Compressed air and standby are the silent cost item
The residual load outside production hours is often substantial in practice, and almost always technical, not operational. The profile pinpoints it per meter and per hall.
The defining peak is a choice, not a given
Know which quarter-hour maxes out the contract and you can adjust start-up sequences and batch planning. Peak shaving through planning costs nothing; peak shaving with a battery only makes sense once the profile substantiates it.
Congestion turns the profile into a production asset
In a congested grid area, extra capacity is simply not for sale. Your own profile (shifting, buffering, curtailment) is then the only lever you control yourself.
From the field · Industry
Production company measures consumption per process
For large orders in the production halls, the company follows energy consumption at quarter-hour level, so that consumption per order becomes visible.
Result
Gas and electricity consumption per production process at quarter-hour level.
Energy Intelligence for industry & logistics.
Start with Consumption Analysis per meter. You only add Financial Analysis and Capacity Analysis when they add value.
Consumption Analysis
Base rate per meter for consumption, locations and trends.
Book a no-obligation callRead on in the knowledge base.
In-depth articles on exactly these questions: substantiation, practical examples and step-by-step plans.

Industry software
Which energy software is suitable for industry?
Energy software for industry must be able to analyse peak load, process profiles, contracted capacity, charging infrastructure, costs and data quality. Total consumption alone is usually insufficient, because processes and peaks determine costs and capacity.
Read article

Sector: Industry & logistics
Cutting energy costs in industry and logistics: think in shifts, not monthly totals
You cut energy costs in industry and logistics the way you improve a line: measure per shift, find the losses and tackle the biggest first. A monthly total hides what a quarter-hourly profile reveals: idle consumption at night and weekends, start-up peaks around the shift changeover and simultaneity that drives up contracted capacity. COMCAM makes that profile visible per site and per shift, so operations and finance see the same losses and can steer with precision.
Read article
Grid congestion
How do I solve grid congestion on my business park?
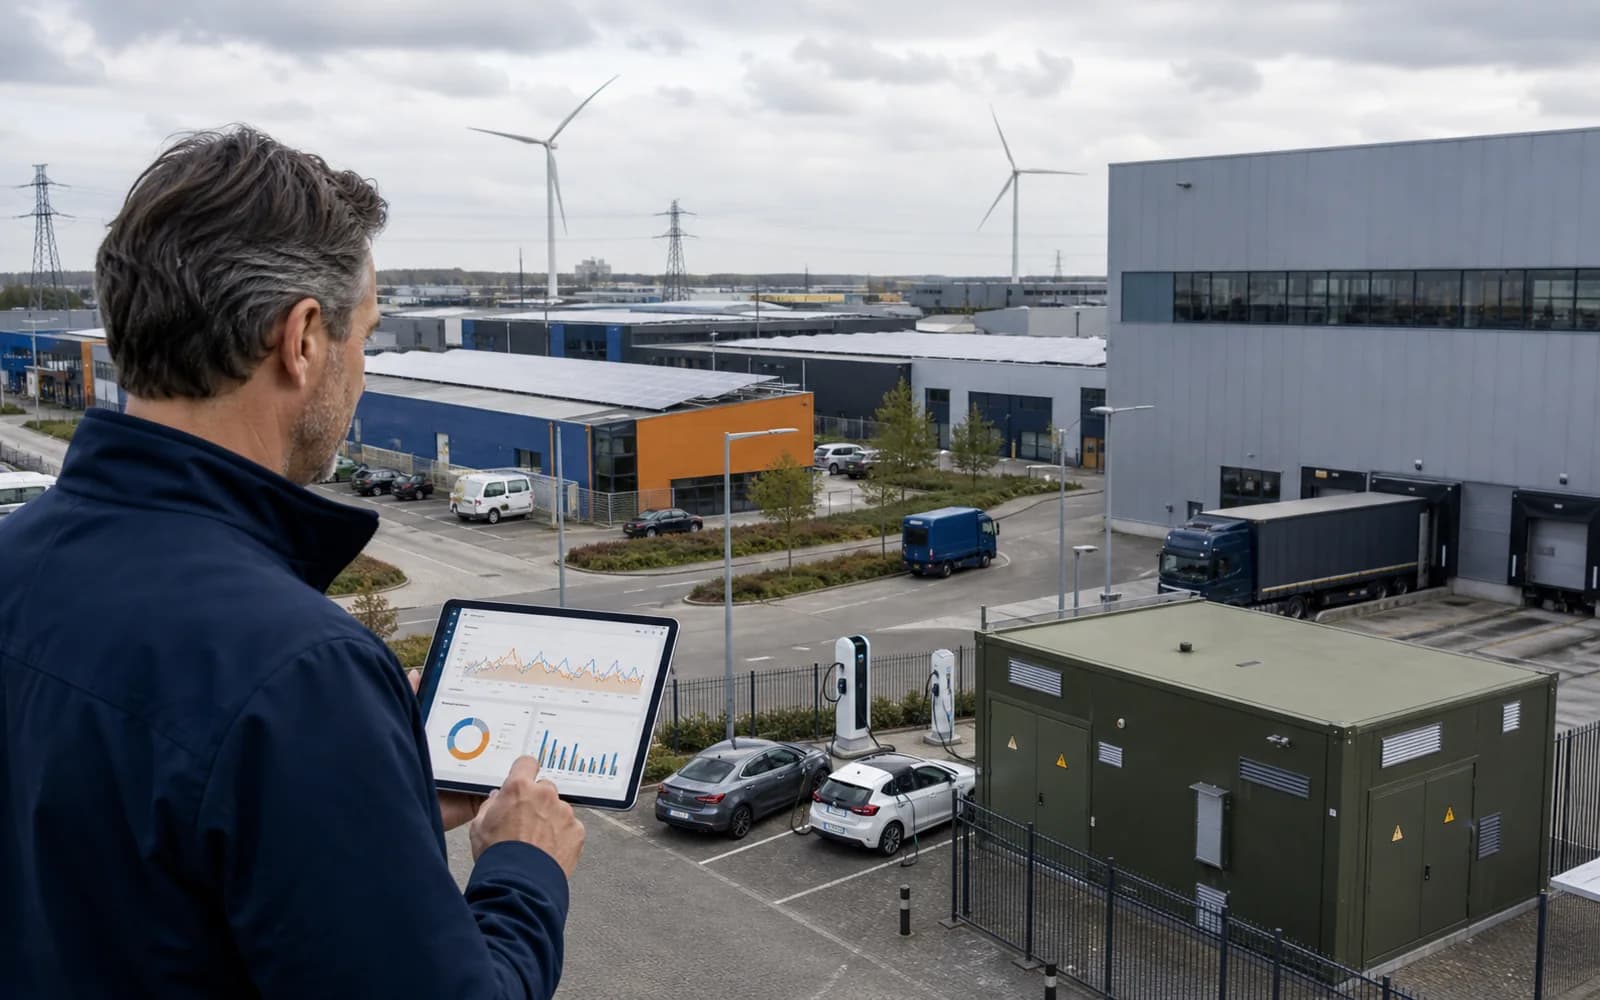
Grid congestion on a business park is not solved with a heavier connection alone. The first step is insight into peaks, simultaneity, contracted capacity, charging profiles and flexibility per business. You can then explore measures such as spreading, control, storage, energy hub agreements or contract optimisation.
Read article
Frequently asked questions about energy insight in industry & logistics.
From metering data and savings opportunities to capacity, regulation and a practical start.
01Where is the first measurable saving opportunity in industry & logistics?
Compressed air and standby are the silent cost item. The residual load outside production hours is often substantial in practice, and almost always technical, not operational. The profile pinpoints it per meter and per hall.
02Which deviations and decisions become visible through comparison in industry & logistics?
The defining peak is a choice, not a given. Know which quarter-hour maxes out the contract and you can adjust start-up sequences and batch planning. Peak shaving through planning costs nothing; peak shaving with a battery only makes sense once the profile substantiates it.
03Which strategic decision can the energy profile substantiate?
Congestion turns the profile into a production asset. In a congested grid area, extra capacity is simply not for sale. Your own profile (shifting, buffering, curtailment) is then the only lever you control yourself.
04Which patterns appear in the energy profile of industry & logistics?
Night-time residual load: Whatever keeps running outside production: compressed-air leaks, standby equipment, hall lighting. Production start: Lines starting simultaneously set the defining peak. Sequential start-up can push it down.
05How does capacity analysis support expansion or electrification?
Under congestion this is your ceiling. Every kW of headroom the profile finds is room to grow. COMCAM compares quarter-hour values with contracted capacity, so additional demand can be assessed before investment decisions are made.
06Which energy data does COMCAM need for industry & logistics?
The foundation consists of quarter-hour values per meter and location. Where available, COMCAM adds gas data, contracted capacity, tariffs, operating hours and relevant asset data. Access is arranged through authorisation or an existing data connection.
07Are additional sensors or submeters always required?
No. Existing smart meters and telemetry data are the logical starting point. Submetering is only added where the main profile cannot answer a specific process question with sufficient precision.
08Which Dutch energy-saving obligations may apply to a location?
In the Netherlands, the energy-saving obligation currently applies from 50,000 kWh of electricity or 25,000 m³ of natural-gas equivalent per location per year. Measures with a payback period of no more than 5 years must be implemented. An extension to 7 years is intended for 1 July 2027, but the five-year threshold remains in force until the change is final. The exact obligation depends on the location, use and activity.

Get in touch
Let your energy data work for you.
Book a no-obligation call. We discuss your energy question, look at your own metering data and whether structural insight adds value.
- Response within one working day
- Dashboard with your own data
- Supplier-independent
- No commitments