
Sector: Aquaculture
Article 15 of 20 · Sector-specific softwareEnergy monitoring for aquaculture and RAS: running continuously, knowing continuously
Direct answer
In a recirculating aquaculture system (RAS) almost everything runs continuously: pumps, aeration, biofilter, water treatment and temperature control. That makes the energy profile flat, so waste never stands out by itself; a small deviation carries through into the entire annual consumption. COMCAM establishes a baseline per system and flags every shift early, so you cut costs and recognise creeping consumption as an early signal of wear or fouling, without ever touching operational reliability.
- Baseline per system and tank
- Creeping consumption as an early signal
- Cutting costs without risk
- Capacity and backup watched
Running continuously on gut feeling versus monitored continuous operation
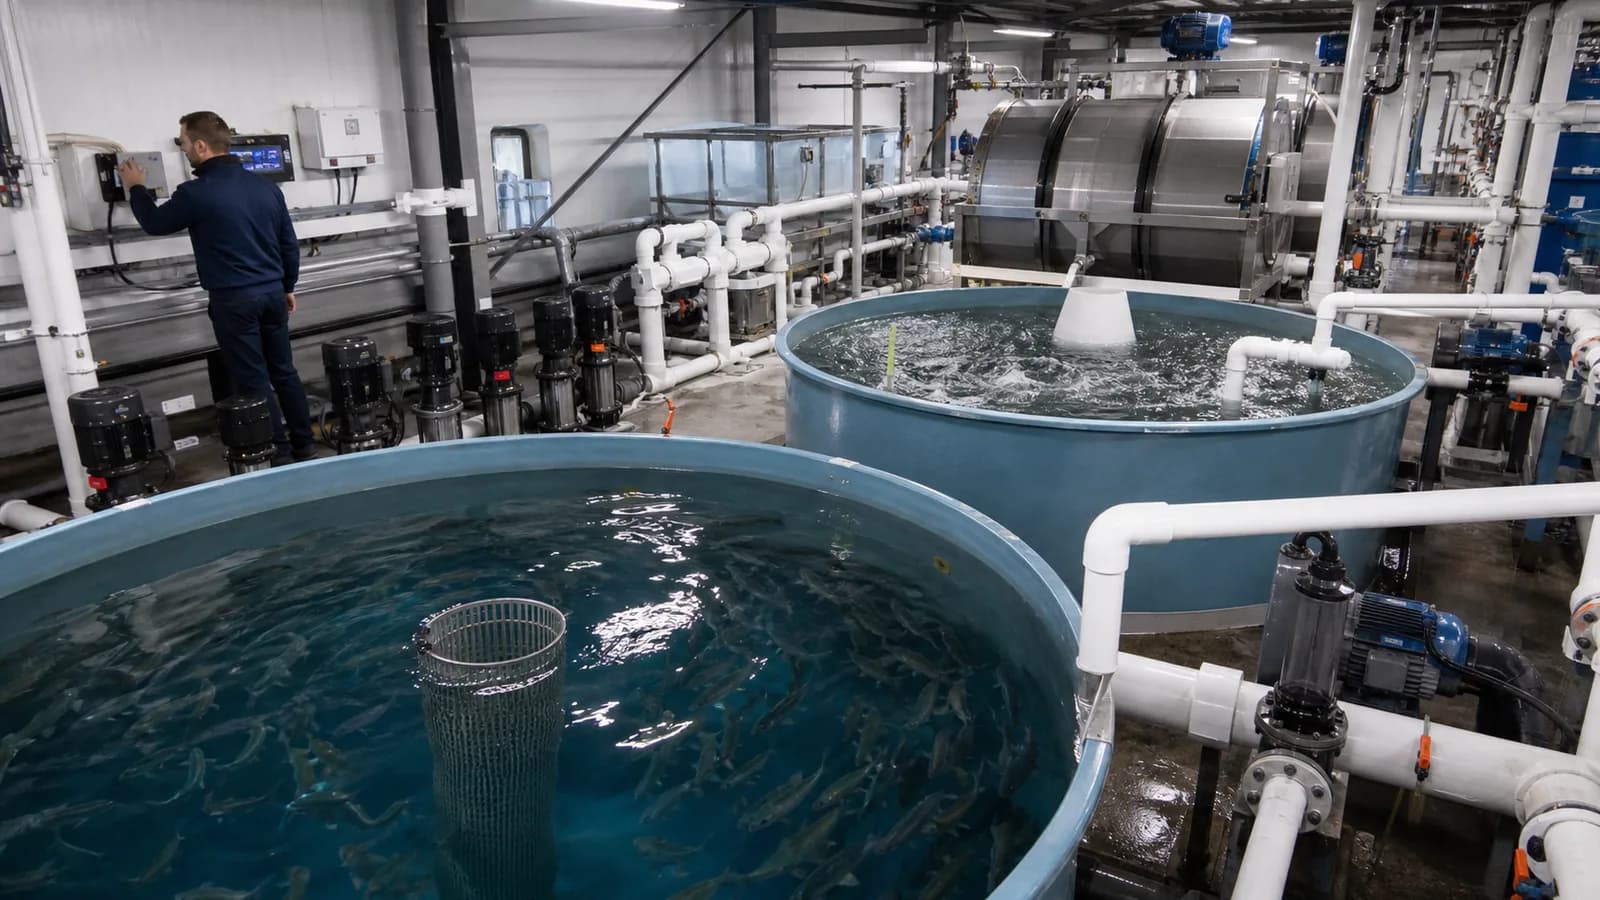
A RAS farm is one of the few businesses where nearly as much is consumed at night as by day, and rightly so: pumps circulate, the aeration runs, the biofilter must hold its oxygen and the water temperature tolerates no slack. But it is precisely that flat, continuous profile that makes flying blind expensive. Where an office betrays its waste at night, nothing stands out at a farm, unless you know what normal looks like. A pump drawing a fraction more through wear or a fouled filter then does so every hour of the year. COMCAM establishes a baseline per system and per tank and watches every shift. Energy insight in aquaculture thus becomes two things at once: a brake on costs and an extra pair of eyes on the installation your entire stock depends on.
- Establish a baseline per system: this is what this tank should draw.
- Recognise creeping consumption of pumps and aeration as an early signal.
- Weigh energy costs into choices on flow, aeration and temperature.
- Watch the connection, contracted capacity and backup as you grow.
Reference
Traditional approach
Everything always runs, so everything seems normal.
Modern approach
A baseline per system makes every deviation visible.
Wear
Traditional approach
A harder-drawing pump only shows at breakdown.
Modern approach
Creeping consumption is flagged early as a maintenance cue.
Costs
Traditional approach
Annual consumption is a given you wait for.
Modern approach
Every structural reduction counts every hour of the year.
Growth
Traditional approach
Expansion unexpectedly hits the connection limit.
Modern approach
Capacity, contracted capacity and backup are tested in advance.
Why a flat profile is exactly what calls for monitoring
At most businesses, the day-night rhythm betrays where waste sits; in a RAS that rhythm barely exists. Pumps, aeration and water treatment are supposed to run continuously, so a deviation hides in a profile that always looks the same. The solution is a baseline per system: what should this tank, this pump group or this aeration line draw at this stocking density and temperature? Every shift against that baseline is meaningful, precisely because the profile should be so stable. And because everything runs continuously, every structural reduction counts in every hour of the year.
- Baseline per tank, pump group and aeration line.
- Deviations weighed by stocking density and water temperature.
- Small structural differences with a large annual effect.
- Comparison between similar systems as a second reference.
- Alerts only on meaningful shifts, no noise.
Energy data as an early signal for your installation
At a farm, energy consumption is not only a cost item but also a health reading of the equipment. A circulation pump gradually demanding more at the same flow points to wear or a fouled line; aeration having to work harder can indicate a clogged filter or changing water quality. By following those trends per system, you see maintenance questions coming before they become failures, and in a RAS, every prevented failure counts. Energy monitoring does not replace your technical inspections and water analyses, but it gives them direction: look there first.
- Creeping pump consumption as an indication of wear or fouling.
- Aeration working harder as a cue to inspect.
- Trends per system, not just totals per meter.
- Direct maintenance to where the data points.
- A complement to technical inspections, not a replacement.
Growth, backup and starting modularly
Whoever adds tanks or raises stocking density also increases the continuous load, and that must fit within the connection, the contracted capacity and the backup power that keeps the stock alive during an outage. The actual quarter-hourly profile shows how much headroom exists and what an expansion adds to it, so you grow on data rather than hope. COMCAM is built modularly with a fixed price per meter per month, finalised once the scope is set. In a no-obligation call you discuss the baseline of your own systems and where the first gains sit.
- Continuous load tested against connection and contracted capacity.
- Expansions substantiated with the actual profile.
- Backup power sized on the actual load.
- Fixed price per meter per month, modularly extendable.
- No-obligation call: the baseline of your own farm as the start.
Curious what this looks like with your own data?
In a no-obligation call, a specialist looks at your meters, sites and energy questions with you. Response within one business day.
Search the knowledge base
Find the answer to your question.
Search using your own words. Abbreviations and spelling variants are recognised, so EMS also finds the articles on energy management systems.
Topic
