
Energy management for a distribution centre: cooling, charging infrastructure and peaks in view
Direct answer
Energy management for a distribution centre brings cooling, lighting, charging infrastructure and peak load together in one central control view. The biggest cost risks often arise from simultaneous charging and cooling, which makes peak load and contracted capacity more decisive than total consumption.
- Cooling, lighting and charging infrastructure in one view
- Track peak load and simultaneity
- Monitor contracted capacity and grid capacity
- Cost impact made visible per process
Standalone meters versus energy management for a DC
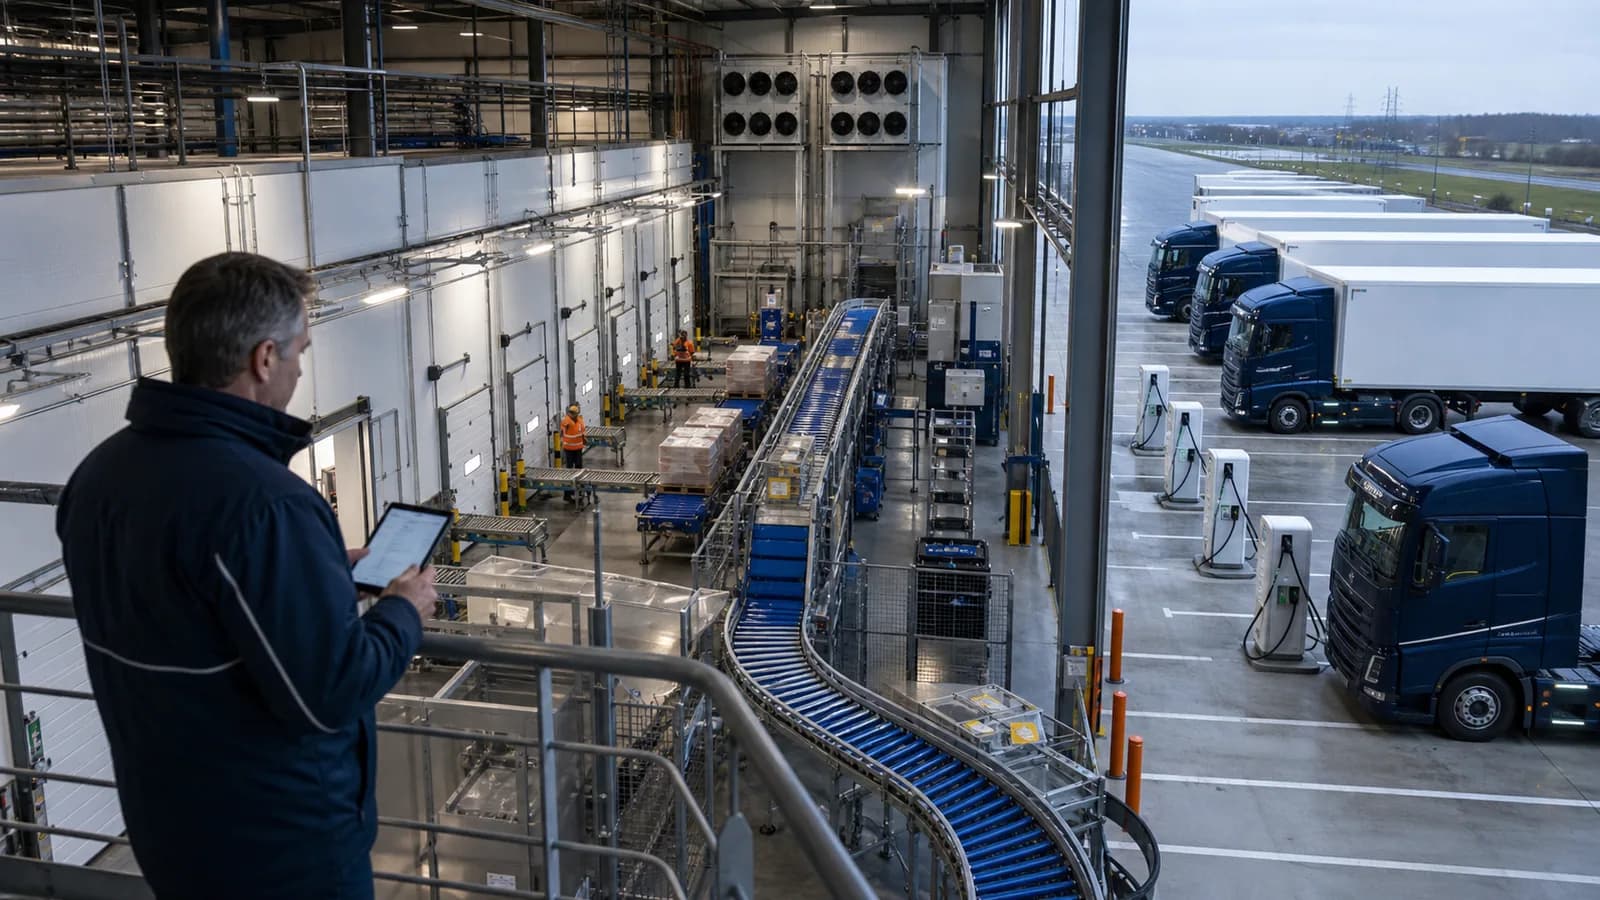
Distribution centres combine cooling, lighting, automation and increasingly charging infrastructure for electric vehicles. As a result, the challenge shifts from total consumption to simultaneity and peak load. Energy management makes visible when peaks arise, what they cost and how charging and cooling influence each other, so decisions are well-founded.
- Cooling and charging infrastructure often determine the peaks in a distribution centre.
- The simultaneity of processes is decisive for contracted capacity and costs.
- Central insight helps operations and finance make the same decisions.
Overview
Traditional approach
View cooling, charging and lighting separately.
Modern approach
All processes in one central control view.
Peaks
Traditional approach
Only visible on the invoice.
Modern approach
Recognise simultaneous charging and cooling in advance.
Decision
Traditional approach
Adjust reactively.
Modern approach
Spread charging on a sound basis or review contracted capacity.
Why peak load works differently in a DC
In a distribution centre, cooling and charging infrastructure can peak at the same time, especially during fast charging of electric trucks. That simultaneity drives up contracted capacity.
- Analyse charging and cooling peaks together.
- Link simultaneity to contracted capacity.
- Spread charging moments where possible.
- Detect grid capacity risk early.
Which data sources help?
Quarter-hour values from the main meter provide a solid foundation. Submetering on cooling or charging infrastructure deepens the picture where needed.
- Quarter-hour values for electricity.
- Submetering on cooling, charging and lighting.
- Contracted capacity and grid capacity as context.
- Alerts on atypical night-time consumption and data quality.
Curious what this looks like with your own data?
In a no-obligation call, a specialist looks at your meters, sites and energy questions with you. Response within one business day.
Search the knowledge base
Find the answer to your question.
Search using your own words. Abbreviations and spelling variants are recognised, so EMS also finds the articles on energy management systems.
Topic
