
Energy data
Article 4 of 25 · Energy insight and dataReal-time energy monitoring: a guide for businesses
Direct answer
Real-time energy monitoring is following your energy use almost as it happens, instead of only afterwards on the invoice. You read the consumption at the source, for example via the P1 port of the Dutch smart meter or via submeters per machine or department, and see it live on a screen or in an app. This tells you not only how much you use, but also when and where.
- Clear definition
- Data-driven assessment
- Risks and opportunities visible
- Practical next steps
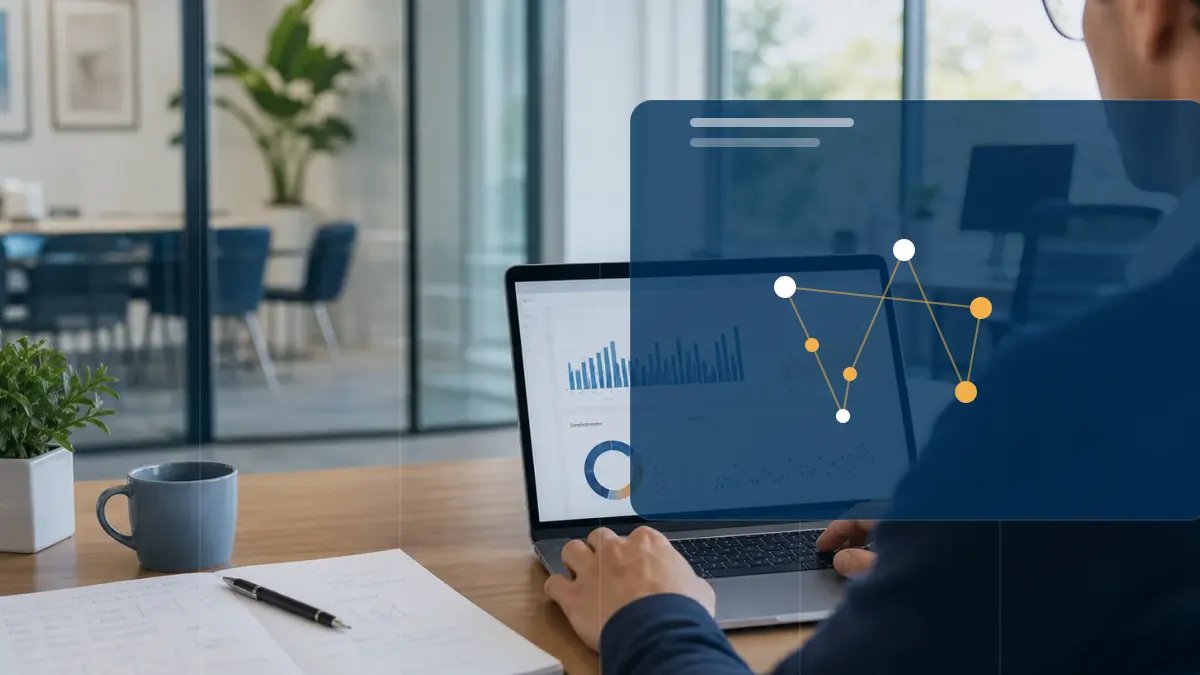
Real-time energy monitoring: scattered information versus Energy Intelligence
Many businesses only know their energy use from the monthly or yearly invoice. By then an expensive peak or a leaking installation has long since happened before you notice. Take a bakery: if the ovens keep running at night while no one is baking, that only shows up weeks later on the bill. Real-time energy monitoring reverses that order. You see the use while it happens and can act at once. This matters to any entrepreneur who wants a grip on costs and on their load on the grid.
- The Dutch smart meter has a P1 port that lets you read your consumption yourself and free of charge, almost in real time, by connecting an energy display or app.
- Submeters behind the main meter reveal which machine, department or installation causes the use; the main meter alone shows only the total.
- The Dutch agency RVO summarises the approach as measure, save and steer: insight into consumption and feed-in over time is the first step to tackle peaks and waste.
Insight
Traditional approach
Information is scattered across portals, documents, invoices or separate spreadsheets.
Modern approach
Data, context and interpretation are brought together into a clear decision picture.
Decision-making
Traditional approach
Choices are made based on averages, assumptions or occasional analyses.
Modern approach
Scenarios, KPIs and current measurement data make the trade-off more concrete and repeatable.
Follow-up
Traditional approach
Actions often stay non-committal or disappear into separate reports.
Modern approach
Follow-up actions, monitoring and reporting are linked to the same energy data.
How does real-time energy monitoring work?
Real-time energy monitoring reads consumption at the source and shows it almost instantly. The best-known source is the P1 port of the Dutch smart meter. That is a connection you may use to read the meter yourself, free of charge. You connect an energy display or app to it and see your consumption and feed-in live on a screen or phone. For more detail you add submeters behind the main meter, for example per machine, group or department. The main meter shows only the total; submeters show where it comes from. The readings come together in a dashboard that shows the course over time, so peaks and patterns become visible.
- The P1 port of the smart meter gives you free access to your own metering data.
- An energy display or app makes consumption visible on a screen or phone.
- Submeters break the total down by machine, group or department.
- A dashboard shows the course over time, not just a final reading.
How does it differ from monthly or invoice data?
Invoice data tells you afterwards how much you used over a whole period, usually as a single total per month. You see that it was expensive, but not when or why. Real-time energy monitoring measures in short intervals and shows the use as it runs. This reveals the pattern across the day: the morning peak, the night-time use, the moment an installation switches on. RVO summarises this as to measure is to know: first gain insight into your consumption and feed-in spread over time. Only when you know when and where you use energy can you save in a targeted way and avoid peaks on the electricity grid. A single total on the invoice does not offer those clues.
- Invoice data is a total afterwards; monitoring shows the course as it happens.
- You see the pattern across the day, including peaks and night-time use.
- Insight into use over time is, according to RVO, the first step: measuring is knowing.
- Only with that insight can you save in a targeted way and avoid grid peaks.
What can you do with it, and where are the limits?
With real-time insight you see peaks the moment they arise and can act at once, for example by spreading or switching off equipment. You catch waste that stays invisible on the invoice, such as equipment that keeps running at night or over the weekend. It also helps with legal obligations: the Dutch energy saving obligation applies to businesses from 50,000 kilowatt-hours of electricity or 25,000 cubic metres of natural gas per year, which must take measures with a payback time of up to five years. Measuring is the basis for that. The limits lie in the follow-up: monitoring delivers a data stream, not savings. Without someone who reads the data and acts on it, it stays at nice graphs. Submeters and connections also need technical attention when setting things up.
- See peaks as they arise and act at once by spreading or stopping use.
- Catch waste that stays invisible on the monthly invoice.
- Metering data supports the energy saving obligation from 50,000 kWh or 25,000 m3 per year.
- The limit: data without follow-up saves nothing, and the setup needs technical attention.
Curious what this looks like with your own data?
In a no-obligation call, a specialist looks at your meters, sites and energy questions with you. Response within one business day.
Search the knowledge base
Find the answer to your question.
Search using your own words. Abbreviations and spelling variants are recognised, so EMS also finds the articles on energy management systems.
Topic
