
Energy data
Article 16 of 25 · Energy insight and dataChoosing an energy intelligence platform: a guide for businesses
Direct answer
An energy intelligence platform is software that collects, cleans and turns meter, submeter and installation data into usable insight: consumption, costs, peaks and anomalies. When choosing an energy intelligence platform you look above all at data connections, the granularity of the data, reliable reporting, and ownership of your own data. A good platform lets you decide on evidence rather than on gut feeling.
- Clear definition
- Data-driven assessment
- Risks and opportunities visible
- Practical next steps
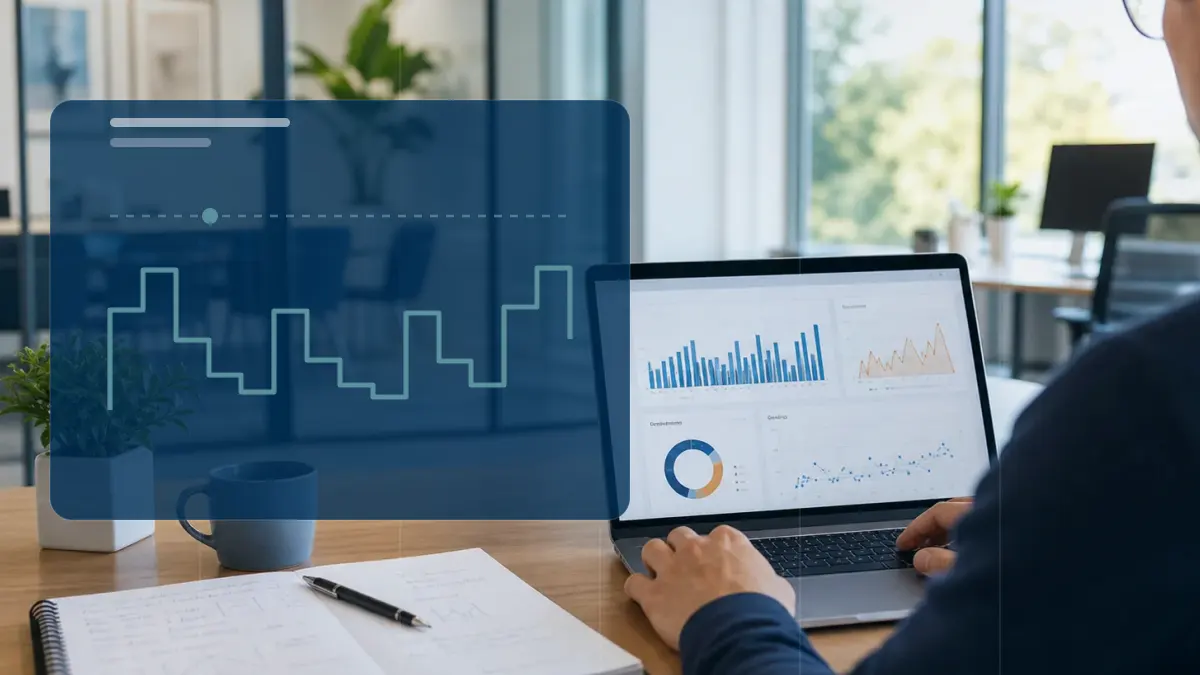
Choosing an energy intelligence platform: scattered information versus Energy Intelligence
As soon as you want more than the annual figure on your energy bill, you hit the limits of a spreadsheet. Typing meter readings by hand costs time, misses anomalies and gives no view of peaks within the day. An energy intelligence platform takes over that work. It matters to facility managers, business owners and finance leads who want to manage energy on figures. Choosing such a platform is hard, because providers differ strongly in connections, data quality and the freedom you keep over your own data.
- First check the data connections: can the platform read your smart meter via the Dutch P1 port, your submeters and your own installations, ideally at quarter-hour level.
- Ask about reporting and export: can you get your data out for an ISO 50001 system or an EED audit, or are you tied to what the vendor shows you.
- Watch ownership and lock-in: your meter data remains yours, and you want to take all historical data with you if you switch.
Insight
Traditional approach
Information is scattered across portals, documents, invoices or separate spreadsheets.
Modern approach
Data, context and interpretation are brought together into a clear decision picture.
Decision-making
Traditional approach
Choices are made based on averages, assumptions or occasional analyses.
Modern approach
Scenarios, KPIs and current measurement data make the trade-off more concrete and repeatable.
Follow-up
Traditional approach
Actions often stay non-committal or disappear into separate reports.
Modern approach
Follow-up actions, monitoring and reporting are linked to the same energy data.
What do you look at in the data and the connections?
A platform is only as good as the data going into it. So first look at which sources it can connect. Think of the smart meter via the Dutch P1 port, submeters per department or machine, and API connections with existing systems. Granularity matters: quarter-hour data reveals peaks and patterns that a monthly total hides. Also watch data quality management. Meter series contain gaps and outliers, and a good platform flags and corrects those transparently. Ask as well about KPIs, a baseline and normalisation, for example correction for weather effects, so you compare consumption fairly across periods and locations. Without that foundation you compare apples with pears.
- Connections with the smart meter (P1 port), submeters and APIs of existing systems.
- Quarter-hour data instead of only monthly or annual totals.
- Data quality management: gaps and outliers are made visible.
- Baseline and normalisation, so you compare periods and locations fairly.
- KPIs that fit your business, for example consumption per product or per square metre.
When is a spreadsheet no longer enough?
A spreadsheet works as long as you have few measuring points and occasional insight is enough. Once you have multiple sites, many submeters or mandatory reporting, it breaks down. Manual entry costs too much time and errors creep in. You also miss anomalies that only stand out when you measure continuously. A platform helps here with alarms and anomaly detection: it warns of an unexpected peak or a device that keeps running at night. For multiple sites you want multi-site functionality, so you can place locations side by side. And for obligations such as the Dutch EED audit duty or sustainability reporting under the CSRD, traceable, exportable data is not a luxury but a requirement.
- Multiple sites or many submeters make manual tracking unworkable.
- Alarms and anomaly detection catch deviations you would otherwise miss.
- Multi-site: compare locations side by side in one environment.
- Reporting and export for an ISO 50001 system, an EED audit or CSRD.
- Traceable data is a requirement for mandatory reporting, not an extra.
Which pitfalls do you avoid?
Watch the black box. A platform that shows nice charts but does not explain how it arrives at figures is hard to check and to justify. Ask how calculations are made and whether you can inspect the source data. A second pitfall is outdated factors. Emission factors and tariffs change, and a platform that does not keep them current gives a distorted picture. The third pitfall is lock-in. Your meter data is yours, but not every platform makes export easy. Check whether you can take all historical data with you when switching. Finally, look at usability: a system nobody opens delivers no insight.
- Black box: demand insight into how figures and calculations are made.
- Outdated emission factors or tariffs give a distorted picture.
- Lock-in: check whether you can export all historical data.
- Ownership: your meter data stays yours, also after a switch.
- Usability: a platform nobody uses delivers nothing.
Curious what this looks like with your own data?
In a no-obligation call, a specialist looks at your meters, sites and energy questions with you. Response within one business day.
Search the knowledge base
Find the answer to your question.
Search using your own words. Abbreviations and spelling variants are recognised, so EMS also finds the articles on energy management systems.
Topic
