
Energy data
Article 11 of 25 · Energy insight and dataForecasting energy consumption: a guide for businesses
Direct answer
Forecasting energy consumption means estimating your future usage based on historical metering data and variables such as the weather, production and your business calendar. You calculate how much energy you will need over the coming hours, days or weeks. You use that forecast to purchase energy, manage peaks and monitor your budget.
- Clear definition
- Data-driven assessment
- Risks and opportunities visible
- Practical next steps
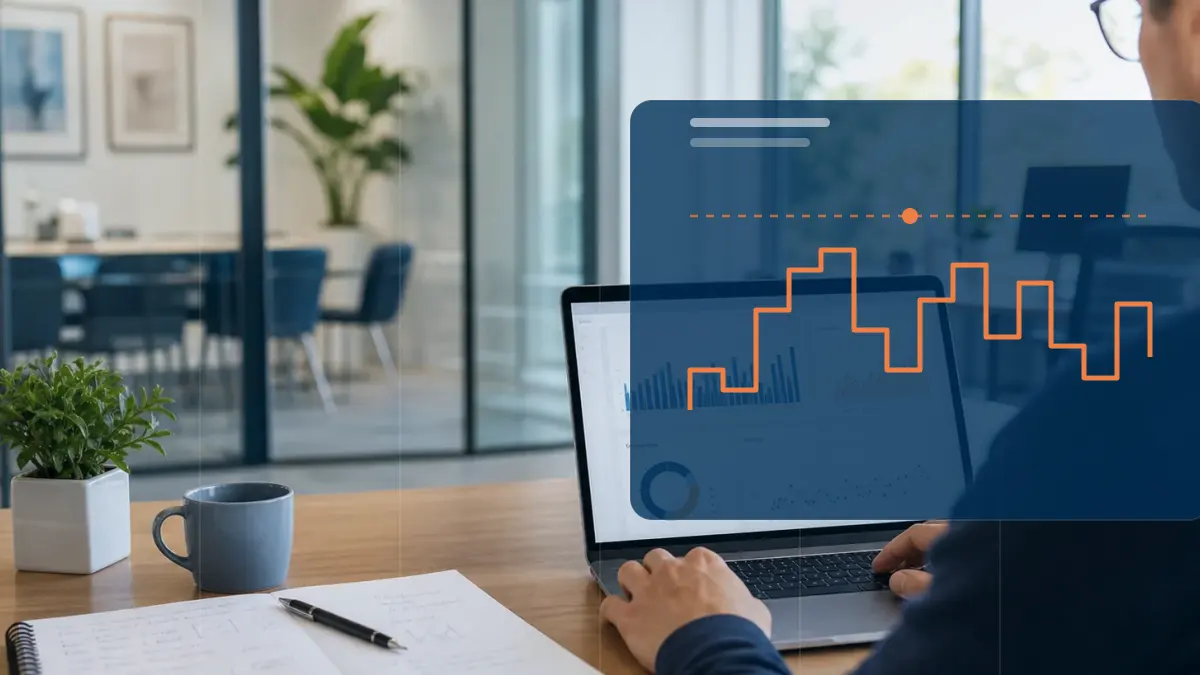
Forecasting energy consumption: scattered information versus Energy Intelligence
Anyone buying energy or trying to relieve the grid wants to know what tomorrow brings. A factory running an extra shift on Monday uses more than on a quiet Sunday. Grid operators and market parties have therefore been making consumption forecasts for decades to keep supply and demand in balance. The same applies to businesses on a smaller scale: a good forecast prevents costly surprises when purchasing and helps in planning production and flexibility.
- A forecast combines your own history with external variables such as temperature, daylight, production planning and public holidays.
- Methods range from simple statistics, such as extending existing patterns, to machine learning that weighs many variables at once.
- The quality depends on reliable metering data; a change in how your business operates makes old patterns less useful.
Insight
Traditional approach
Information is scattered across portals, documents, invoices or separate spreadsheets.
Modern approach
Data, context and interpretation are brought together into a clear decision picture.
Decision-making
Traditional approach
Choices are made based on averages, assumptions or occasional analyses.
Modern approach
Scenarios, KPIs and current measurement data make the trade-off more concrete and repeatable.
Follow-up
Traditional approach
Actions often stay non-committal or disappear into separate reports.
Modern approach
Follow-up actions, monitoring and reporting are linked to the same energy data.
How does energy consumption forecasting work?
A forecast starts with your own metering data: how much did you use over the past weeks, per hour or per quarter hour. That history contains fixed patterns, such as working days versus weekends and day versus night. You then add variables that explain the consumption. Temperature drives the demand for cooling and heating, daylight the yield of solar panels, and your own calendar the level of production activity. A model captures the relationship between those variables and consumption, and projects it into the future. The further ahead you look, the more uncertain the outcome. A forecast for tomorrow is usually more accurate than one for next month.
- The basis is your own consumption history at hourly or quarter-hourly level.
- Explanatory variables include temperature, daylight, production planning and public holidays.
- A model captures the relationship between variables and consumption and projects it.
- Looking further ahead means greater uncertainty in the outcome.
Which methods exist?
The methods vary in complexity. On the simple side are statistical approaches: you extend existing patterns or use a regression that describes the relationship with, for example, temperature. Those models are easy to understand and often work surprisingly well for stable consumption. On the other side is machine learning, where an algorithm weighs many variables at once and learns non-linear relationships from large amounts of data. That can be more accurate for erratic consumption, but it requires more data and is harder to explain. There is no single best method for everyone: the choice depends on your data quality, how erratic your consumption is and how far ahead you want to look.
- Statistical methods extend patterns or capture a relationship through regression.
- Machine learning weighs many variables and learns non-linear relationships from data.
- Simple models are easier to understand; complex models require more data.
- The right method depends on data quality, volatility and the horizon.
What do businesses use a forecast for?
Businesses mainly use a consumption forecast for purchasing. Those who know how much energy they will need can contract more precisely and have to buy or sell less on the short-term market, where prices fluctuate strongly. A forecast also helps with peak management: if you see a peak coming, you can shift consumption or switch off temporarily. Flexibility use also leans on forecasts. If you know when you have room, you can charge a battery or move processes to cheaper hours. Finally, the forecast serves as the basis for your budget: a well-founded expectation makes your energy costs more predictable and easier to account for.
- Purchasing: contract more precisely and adjust less on the fluctuating short-term market.
- Peak management: spot an approaching peak in time and shift or switch off consumption.
- Flexibility use: charge batteries or plan processes at favourable moments.
- Budget: a well-founded expectation makes energy costs more predictable.
Curious what this looks like with your own data?
In a no-obligation call, a specialist looks at your meters, sites and energy questions with you. Response within one business day.
Search the knowledge base
Find the answer to your question.
Search using your own words. Abbreviations and spelling variants are recognised, so EMS also finds the articles on energy management systems.
Topic
