
Energy data
Article 3 of 25 · Energy insight and dataEnergy dashboard explained for businesses
Direct answer
An energy dashboard is a visual screen that shows your energy consumption in charts, key figures and trends, instead of only on the invoice. It brings measurement data from meters and submeters together in one place and flags deviations. So you see not only how much you consume, but also when, where and whether that differs from what is normal.
- Clear definition
- Data-driven assessment
- Risks and opportunities visible
- Practical next steps
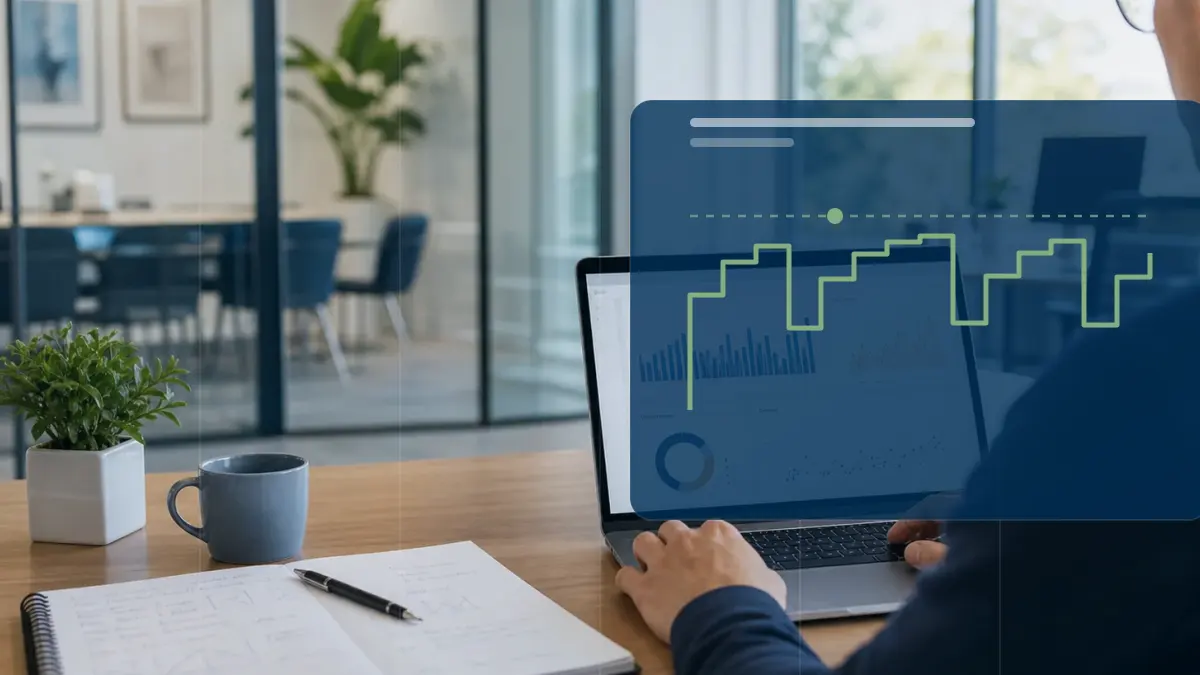
Energy dashboard explained: scattered information versus Energy Intelligence
Many businesses only learn their energy consumption afterwards, from the annual settlement. By then steering is too late: a leaking compressed-air system or a cooling unit running all night stays unnoticed for months. RVO summarises energy management as measuring, saving and steering. An energy dashboard belongs to that first step. It makes consumption visible on a screen, so a facility manager or business owner recognises patterns and can intervene in time.
- An energy dashboard draws on measurement data: the main meter, submeters per machine or department, and interval data such as quarter-hour values.
- It translates raw data into overview: consumption over time, key figures, comparisons between periods or locations, and alerts on deviations.
- A dashboard is only as good as the data beneath it and the follow-up after it; without reliable measurement and action it delivers no saving.
Insight
Traditional approach
Information is scattered across portals, documents, invoices or separate spreadsheets.
Modern approach
Data, context and interpretation are brought together into a clear decision picture.
Decision-making
Traditional approach
Choices are made based on averages, assumptions or occasional analyses.
Modern approach
Scenarios, KPIs and current measurement data make the trade-off more concrete and repeatable.
Follow-up
Traditional approach
Actions often stay non-committal or disappear into separate reports.
Modern approach
Follow-up actions, monitoring and reporting are linked to the same energy data.
What is an energy dashboard?
An energy dashboard is the visual layer on top of your measurement data. It shows energy consumption in charts and key figures, such as consumption per day, per hour or per location. Where a meter reading gives only a total, a dashboard reveals the course, peaks and trends. Many dashboards compare periods with each other, for example this week against last week, or place sites side by side. Alerts are part of it too: the dashboard signals when consumption exceeds a threshold or deviates from the usual pattern. This makes a mountain of numbers readable for someone without an energy background, and shifts the conversation from the bill to the cause.
- Shows consumption over time in charts, not just a meter reading.
- Works with key figures, for example consumption per unit of product or per square metre.
- Compares periods, departments or sites with each other.
- Signals deviations and peaks with alerts or notifications.
Where does a dashboard get its data?
A dashboard shows nothing without measurement beneath it. The basis is your main meter. In the Netherlands the smart meter has a P1 port for this, with which you can read consumption almost in real time. To know which machine or department causes the consumption, you need submeters behind the main meter. Those give consumption per installation instead of only the total. Many meters supply interval data: measurements per fixed time slot, in the Netherlands often quarter-hour values. That fine-grained data reveals peaks and night-time use that disappear in a monthly total. The dashboard gathers these sources, converts them into overview and stores the history so you can look back and compare.
- The main meter and the smart meter's P1 port supply the total consumption.
- Submeters make visible which machine or department consumes.
- Interval data, often quarter-hour values, show peaks that vanish in a monthly total.
- The dashboard stores history for comparison and trend analysis.
What does a business use it for, and what are the limits?
Businesses use an energy dashboard for three things: insight, steering and reporting. Insight means understanding where and when energy leaks away. Steering means intervening, for example switching off an installation at night or shifting a peak. Reporting means accountability, towards management or for obligations. A standard such as ISO 50006 helps here: it describes how to establish performance indicators and a reference period, so you compare consumption fairly over time. The limit matters: a dashboard measures and shows, but does not act by itself. Without reliable measurement data it shows the wrong reality, and without someone who acts on the alerts, it remains a nice screen without any saving.
- Insight: recognising where and when consumption arises and leaks away.
- Steering: well-founded intervention, such as switching off or shifting peaks.
- Reporting: accountability towards management or for obligations.
- A standard such as ISO 50006 sets indicators and a reference period for fair comparison.
- Limit: the dashboard shows, but good data and follow-up determine the value.
Curious what this looks like with your own data?
In a no-obligation call, a specialist looks at your meters, sites and energy questions with you. Response within one business day.
Search the knowledge base
Find the answer to your question.
Search using your own words. Abbreviations and spelling variants are recognised, so EMS also finds the articles on energy management systems.
Topic
