
Consumption analysis
Article 1 of 4 · The analyses in depthWhat is consumption analysis? From quarter-hourly data to a grip on every meter
Direct answer
Consumption analysis is the step-by-step dissection of your energy consumption: per meter, per site, per quarter-hour. Not to produce pretty charts, but to see when, where and why energy is being used. It is the foundation under every saving, every capacity question and every good energy conversation.
- From annual total to quarter-hourly view
- Per meter, site and energy carrier
- Foundation for savings and capacity
- No extra hardware required
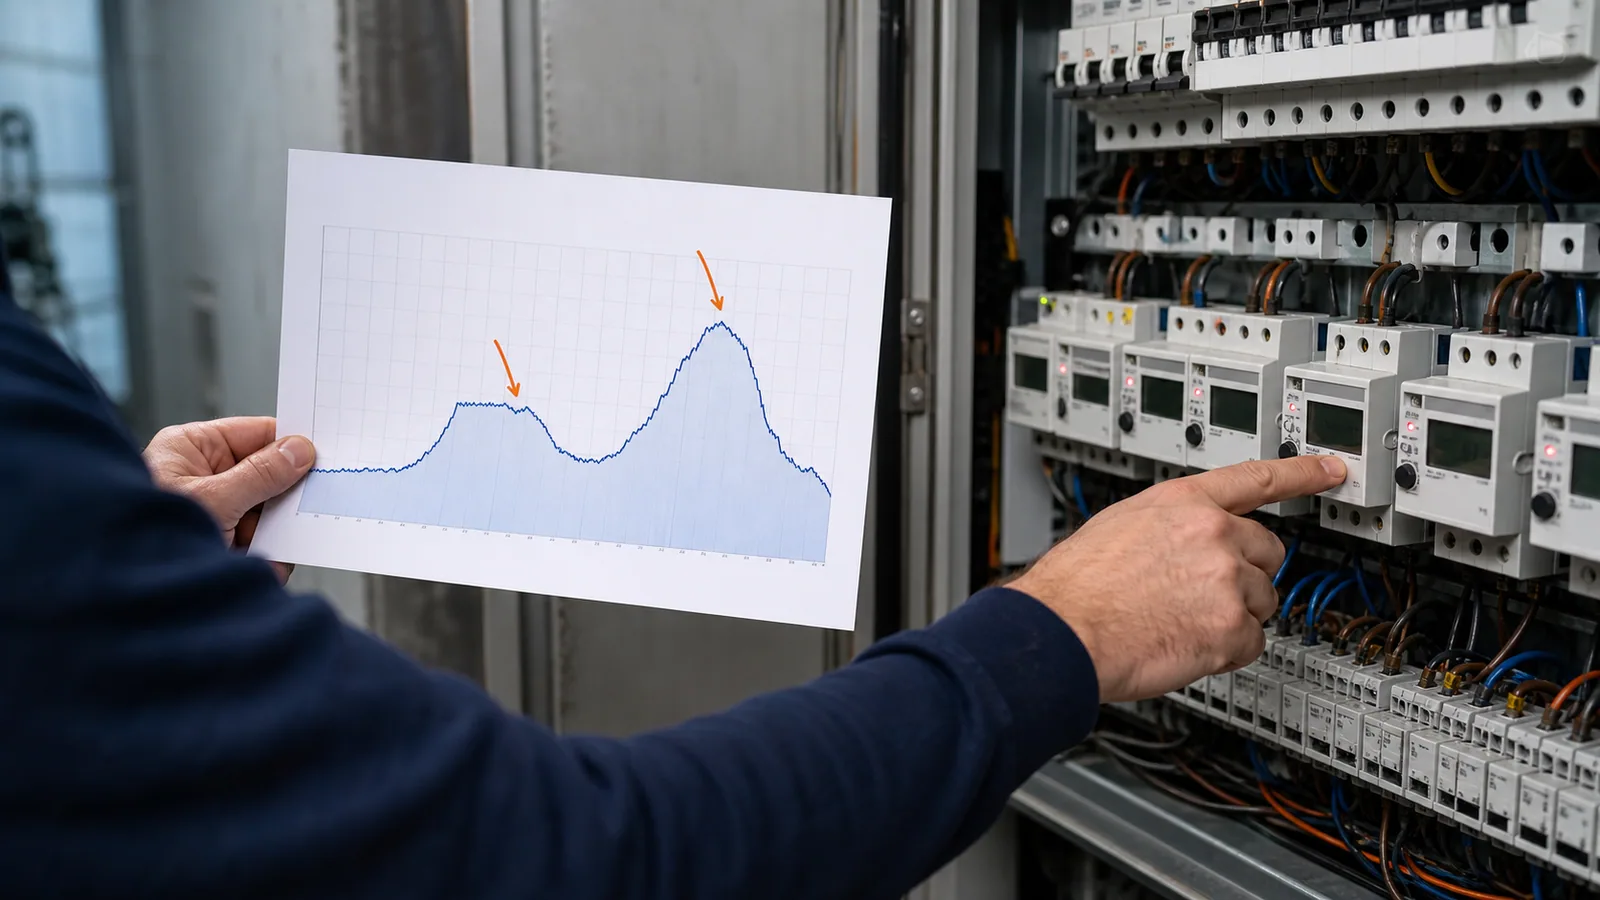
Consumption analysis versus the annual statement
Everyone knows their annual statement; almost no one knows their consumption. That is not a reproach, but a logical consequence of how energy is billed: a total amount after the fact, with no story attached. Consumption analysis turns that around. It takes the measurement data your smart meters already record and turns it into a readable story: this is what happens on Monday morning, this keeps running through the weekend, this site deviates from the rest. Anyone who has seen that story once never looks at an energy invoice the same way again. The beauty of it is that no extra hardware is needed: the data is already there, it just has not been told yet. This page walks you through what consumption analysis really is, why it forms the foundation under every energy decision and which components come together in it, from the first picture for the layperson to the deep dive for the specialist.
- Consumption analysis shows when, where and why energy is consumed, not just how much.
- The building blocks: quarter-hourly data, load profiles, comparison between sites and the night and weekend picture.
- Without consumption analysis, savings, peaks and deviations remain guesswork based on the annual statement.
- It works for gas and electricity together, across all your meters and sites.
Level of detail
Traditional approach
One total per year or per month, after the fact.
Modern approach
Quarter-hourly values per meter, updated automatically every day.
Question it answers
Traditional approach
How much did I consume and what does it cost?
Modern approach
When, where and why do I consume, and what could be different?
Deviations
Traditional approach
Only noticed when the bill disappoints.
Modern approach
Become visible as soon as the pattern changes.
Multiple sites
Traditional approach
Separate invoices and portals side by side.
Modern approach
A comparable view across all meters and sites.
Why consumption analysis matters, even without technical knowledge
For most organisations, energy is one of the few cost items that is watched but never looked into. The annual statement says how much; consumption analysis tells you why. That difference is bigger than it sounds. A building that simply keeps running through the weekend, a cooling installation working harder than necessary, a site that structurally consumes more than a comparable branch: these are all patterns that remain completely invisible in an annual total and stand out within minutes in a load profile. You do not need to be able to read kilowatt-hours for that. A good consumption analysis translates the data into recognisable questions: is it right that there is consumption here outside opening hours? Why does this site peak at the same time every morning? That suddenly puts energy on the agenda, even at tables where meters are never mentioned.
- The annual statement shows how much; the load profile shows why.
- Patterns such as weekend consumption or morning peaks are immediately recognisable, even for non-specialists.
- Energy becomes a shared topic for facility, finance and management at the same time.
- The first insight comes from data you already have, without extra sensors.
The components of a good consumption analysis
Consumption analysis is not a single chart but an interplay of building blocks that reinforce one another. The basis is quarter-hourly data: consumption per fifteen minutes, for electricity and gas. On top of that comes the load profile, which summarises those quarter-hours into a recognisable daily and weekly rhythm per meter. The third building block is comparison: between periods, to see trends and changes, and between sites, to find outliers that look normal on their own. The fourth is the night and weekend picture, which shows what is being consumed while no one is there, often the fastest route to savings. Anyone who combines these components across all meters no longer has loose numbers but a steering view.
- Quarter-hourly data: consumption per fifteen minutes as the smallest building block.
- Load profiles: the daily and weekly rhythm per meter and per site.
- Comparison between periods and between sites to find trends and outliers.
- Night and weekend picture: what keeps running while no one is working?
- Everything per energy carrier: electricity and gas viewed in context.
For the expert: from load profile to base load
Those who look deeper extract considerably more from the same quarter-hourly data. The load profile per meter shows how consumption relates to opening hours, production rhythm and season. The base load, the consumption that never drops below a certain level, is one of the most revealing indicators: a high base load means by definition that installations run continuously, and the question of whether that is justified always deserves an answer. Laying weekly profiles side by side reveals creeping changes that are invisible day by day, such as a clock left wrong after a power outage or an override that was never reversed. And when benchmarking sites, correct for size and function so the comparison stays fair. The point is not to look at every chart, but to track, per meter, the handful of indicators that summarise its behaviour.
- Base load as an indicator: what is always running, and is that justified?
- Weekly profiles side by side reveal creeping changes in the pattern.
- Benchmarks between sites correct for size and function.
- The ratio of daytime, night-time and weekend consumption as a standing health check per meter.
How to start: from first picture to standing routine
The biggest misconception about consumption analysis is that it would be a project. It is a routine. The first step is small: unlock measurement data and look at the profile per meter. Virtually every organisation finds something in that first picture that raises questions, and that is exactly the point. After that, the work shifts from looking to following up: deviations get an owner, recurring patterns become an agenda item, and the profile becomes the place where every energy question starts. Within COMCAM, consumption analysis is therefore the base module the other analyses build on: capacity, costs and the detection of deviations all use the same foundation. Lay that foundation well and you will notice the follow-up questions present themselves.
- Start small: unlock measurement data and look at the profile per meter.
- Give deviations an owner, otherwise insight remains non-committal.
- Make the load profile the starting point of every energy question.
- Consumption analysis is the foundation that capacity and cost analysis build on.
Curious what this looks like with your own data?
In a no-obligation call, a specialist looks at your meters, sites and energy questions with you. Response within one business day.
Search the knowledge base
Find the answer to your question.
Search using your own words. Abbreviations and spelling variants are recognised, so EMS also finds the articles on energy management systems.
Topic
