
Energy monitoring
Article 13 of 13 · Choosing platforms and providersEnergy monitoring for your business: from measurement data to control over consumption and costs
Direct answer
Energy monitoring for a business makes consumption, peaks and costs visible across meters and sites. The value lies not in the chart itself, but in recognising anomalies, out-of-hours base load and peak moments and translating them into concrete measures.
- Central insight into consumption and costs
- Peaks and out-of-hours base load visible
- Suitable for multiple sites and meters
- Supplier-independent and data-driven
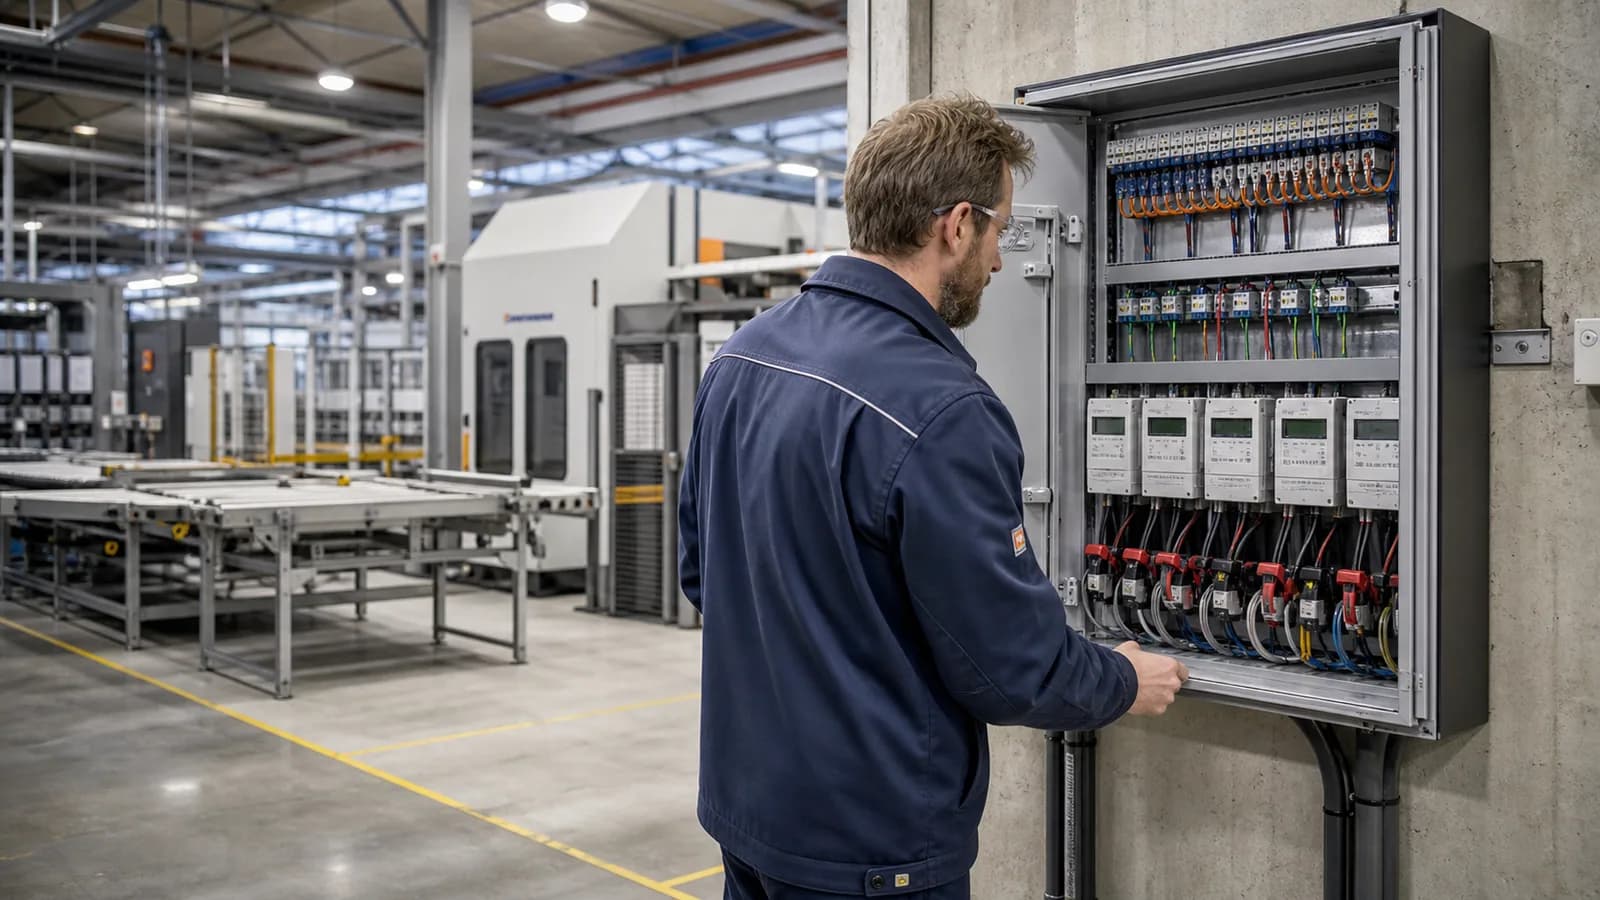
Separate overviews versus structural energy monitoring
Many businesses already have measurement data or supplier overviews, but lack a central picture of what needs attention. Energy monitoring helps bring consumption, peak load and costs together, so facility, finance and operations see more quickly where saving or follow-up is needed. For organisations with multiple locations this is often the difference between reacting to the invoice and steering on data.
- Energy monitoring brings consumption, peaks and costs centrally into view.
- It becomes valuable with multiple meters, sites or contracts.
- The gain arises from turning anomalies and out-of-hours base load into actions.
Picture
Traditional approach
Consumption per month or per invoice.
Modern approach
Quarter-hour values, peaks and anomalies per site.
Signalling
Traditional approach
Anomalies are only noticed at the settlement.
Modern approach
Out-of-hours base load and peaks become visible early.
Reach
Traditional approach
Per meter or per supplier portal.
Modern approach
Across sites, meters and contracts.
Follow-up
Traditional approach
Manual interpretation.
Modern approach
Prioritise concrete measures and follow-up.
What does energy monitoring deliver to a business?
Energy monitoring makes visible where consumption is inexplicably high, when peaks arise and which sites deviate. This clarifies where saving, technical follow-up or contract attention has the most effect.
- Recognise always-on consumption outside opening hours.
- Link peak load to contracted capacity.
- Compare sites with one another.
- Make the cost impact of anomalies visible.
How do you start with energy monitoring?
A practical start begins with access to measurement data, an overview of meters and sites and a check of data quality. After that, consumption can be placed in context with opening hours, activity and costs.
- Arrange access to quarter-hour or measurement data.
- Record meters, sites and EAN structure.
- Check data quality before drawing conclusions.
- Link consumption to activity and costs.
What data does energy monitoring need?
The basis consists of measurement data per interval, site and meter context, contracted capacity and cost components. The more complete the context, the more sharply anomalies and savings opportunities become visible.
- Quarter-hour values for electricity and gas.
- Site, building and EAN structure.
- Contracted capacity and tariff components.
- Alerts on night consumption and data quality.
Curious what this looks like with your own data?
In a no-obligation call, a specialist looks at your meters, sites and energy questions with you. Response within one business day.
Search the knowledge base
Find the answer to your question.
Search using your own words. Abbreviations and spelling variants are recognised, so EMS also finds the articles on energy management systems.
Topic
